

FSCE Promotion Statistics 2023
Information about Foreign Service Construction Engineer staffing trends, and promotion/retention statistics are hard to find. Perhaps purposefully so? Fortunately, if you know where to look, you can find enough information to understand the personnel issues. But it's a challenge to piece it together without the insight that you can really only get after you join. With transparency in mind, I'll use open-source links for the data and provide some analysis of what the information might be telling us.
The Department of State Five-Year Workforce Plan (FY 2019-2023)
As you might imagine, the Bureau of Human Resources has a plan to "address the Department's human capital requirements" which "highlights the Department's challenges and achievements in recruiting, hiring, staffing, retaining, and developing employees.
You can find that plan with a Google search of this section's header, which should pull up this link to a 124-page document:
But I'm not an HR person, so I'll limit my observations to the Foreign Service Construction Engineer (FSCE) career field, starting with when I joined in 2012. It's important to note that there was a major reclassification action in 2016 that moved all entry-level (FP-04) FSCEs to FP-03 so that the new de facto entry-grade level became FP-03. The original intent was to allow hiring at both FP-04 and FP-03 grade levels, but since that date, I believe there has only been one FP-04 hired to date, which you can deduce from the lack of eligible FP-04s competed for promotion since 2016. That chart is further down this post.
Retention
Part of the staffing challenge is retention. The 2019-2023 HR plan for Construction Engineers is succinctly captured in two tables in that document. Table 11 shows that between 2014-2018, the average annual attrition rate was 5 FSCEs per year. That works out to a retention rate of around 95%.

What's interesting though, is that the projection for 2019-2023 was to lose only two people in the entire career field per year, and solely to retirements. I don't know where they got this number, but it seems to ignore the fact that this is a very optimistic objective, given that historically twice as many have left annually (and not all of them were by retirement. Those stats reference Table A1 in the Appendix, so let's look at it.

Table 1A consists of all of the Foreign Service Skill Groups, for both Generalists (FSO) and Specialists (FSS). There is something interesting about the data in this table, if you take a moment to look at it. Do you see what it is? There are projected numbers for non-retirements for the Generalists between FY19 to FY23 but not for most Specialists (including Construction Engineers).
Considering that Specialists are hired for their specialized skills which are marketable, this seems like someone didn't want to even consider that people with sought-after skills might voluntarily leave the Foreign Service before retirement. For what it's worth, about those groups that did provide numbers estimate between 25%-50% of the attrition will be through non-retirement. It's also peculiar that the Department obscures the voluntary and involuntary turnover rates as a lump sum "non-retirement" because there are different action codes for each of those.
Why do I mention retention before promotion? Because it's possible to be retained without being promoted, but getting promoted without being retained just doesn't make much sense. To learn more about employee turnover and retention metrics & KPIs, check out this link:
Promotion Statistics
One of the big factors in retention is employee morale, and competitive promotions in the Foreign Service has a significant influence. So, now you're wondering what the promotion rates have been for Foreign Service Construction Engineers over the last decade, but don't know where to look?
As you might imagine, there are public and non-public files with this info, but it helps to start with a Google search for “FSCE promotion statistics 2019 construction engineer” or 2017, or whatever.
One of those results will likely be the State Department magazine, which often publishes the statistics from the previous year on their website around June or July.
But that site isn't very searchable, and you have to download each of the archived issues separately just to get the link to the historical information.
2019: https://2017-2021.state.gov/wp-content/uploads/2019/12/2019_FS_Promotion_Statistics_by_Grade-.pdf
I'm going to focus my analysis on the first promotion after becoming an FSCE, which is (as of 2016) typically going from FP-03 to FP-02.
There are probably more files out there, but it's only worth going back as far as 2016 when the Department administratively reclassified all FSCEs from FP-04 to FP-03. I was one of the four FP-04s selected for promotion in 2016 out of the 9 competed, but due to the reclassification action, every single FP-04 was effectively "promoted" to FP-03 including those not selected for promotion (who could have been if there were enough positions available). The rules state that you have to have two years in grade as of 1 July of the promotion year to be considered eligible, so the reclassification action also "promoted" all of the FP-04s who were not even eligible yet. Talk about a shortcut!
So, that's why the 2017 and 2018 promotion statistics tables don't show Construction Engineers from FP-04 to FP-03. With that out of the way, let's look at how the promotions worked out for everyone since then based on the publicly available information.
You start getting into some fun multivariable algebra when you try to determine things like the annual hiring rate and attrition rate per grade since these are not explicitly defined anywhere that I could find.
And honestly, looking at it as a year-to-year comparison might not even be practical given how small the numbers are.
But you can somewhat indirectly determine the hiring and attrition rate based on the statistics for the full-time workforce produced by AFSA at https://afsa.org/foreign-service-statistics
Specifically, check out the "2018-06 Foreign Service FTP by Skill group" at this direct link:
If you want to look it up on your own, the Foreign Service Construction Engineer skill code is 6218. Anyways, the important take-aways from the AFSA document are the number in each grade as of June 2018, and there were 86 Construction Engineers in total.

That image is edited to just show the Construction Engineer grades in decreasing order. In case you can't read the numbers, they are:
Senior Foreign Service MC: 2 / OC: 10
FP-01: 26
FP-02: 15
FP-03: 33
FP:04: 0
Note that this pattern should be a pyramid, but it's actually got a bottle-neck at FP-02. Part of this will be resolved when the FP-01s eventually retire, but they can stay in up to age 65 so long as they have less than 30 years of service per 3 FAM 6210.
Since this data is from June 2018, no one that was reclassified in 2016 had yet achieved eligibility to compete for promotion because they needed at least 2+ years as of 1 July 2018. Stated differently, the 2016-2018 promotion stats relate to only those who were FP-03 before the reclassification. but helps to establish a picture of "the before times."
So, in 2016, 2 of 5 FSCEs were selected for promotion to FP-02. The average Time in Class of those competed was 3.1 years, and their average length of service was 6.9 years. This is because most spent about 4 years as FP-04s before becoming FP-03s.

In 2018, 4 of 9 eligible were promoted to FP-2. Average time in class of those competed was 3.6 years, and their average length of service was 7.6 years. So that is a fair representation of it taking about 7.5 to 8 years in the Foreign Service after about 4 years in the previous grade. That would leave up to 5 FP-3s ready to compete for promotion against all of the FSCEs who were reclassified in 2016.
In 2019, there were 27 eligible FP-03s competing for promotion to FP-02. Average time in class of those competed was 3.1 years, and their average length of service was three years earlier than before, at 5.0 years. We also know that in June 2018 there were 33, and if there were 5 remaining candidates from 2018, there should have been 33-5=28 eligibles, not 27. So that's at least one non-retirement attrition right there, which can be attributed to the fact that some folks who had joined in the last few years had already promoted faster than others with more time in service...as evidenced by the Avg length of service of promotees being only 4.5 years... about 3 years less than in 2018. But this was an irregularity stemming from the reclassification.
In 2020, there were only 19 eligibles competed for FP-02. Their average time in class was 4.1 years, and average length of service was 6.2 years. Notably, the average length of service of promotees was 6.4 years, or statistically the same. Still, basically a year longer than last year but still better than "the before times".
As for headcount, considering that 8 were promoted in 2019, that's the same 27 from earlier. Without knowing what the current population is, it's not possible to know the exact number of hires vs attrition, other than that they are equal. But we do know that in 2020, there were 7 of 19 promoted to FP-02, so we're looking at next year having the 12 remaining eligibles plus however many FSCEs were hired in the period of Aug 2017 to July 2018 that have achieved their 2+ years time in grade.
This also means 12 more FSCEs joined between Aug 2017-Jul 2018. And with only 6 promoted to FP-02, that means there should be 18 plus any new FSCEs. This is were the trend starts to be a bit worrisome, as there are more people being hired than being promoted, swelling the pool of candidates and potentially extending the time in grade required to promote to the next level. It's important to note that the statistics in the table only report the time in class of the promotees, and not of everyone competed.
 In 2022, 9 of 23 were selected for FP-02. So at least 7 more were hired in that 2+ year eligibility window to meet the selection board for the first time. The average time in class of those promoted was 4.1 years (roughly 6 months more than 2021). What's interesting about 2022's stats are that the Average time in class of those competed/promoted and average (total) length of service are about a year apart now. This is an indication that there are still hold-overs from the 2016 reclassification action 6 years ago that had time in service before becoming FP-03s.

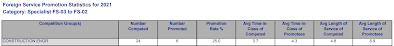
In 2023...well, we have to wait for the results to be officially released.
[insert 2023 FP-03 to FP-02 chart here]
Notice that if you get promoted to FP-02, it’s often a pretty short time to be promoted to the next grade (FP-1), and has taken about 2.6 years for the last two years. But with a growing number of FP-03s being hired and becoming eligible for promotion, that’s a big “if” should the number of promotion opportunities not increase with the number of candidates. Why? Consider this:
The average time in service of promotees to FP-02 is now around 6 years. If it takes 2+ years to be eligible, that indicates that it’s around the third or fourth promotion panel that people get selected for promotion. Nothing wrong with that, but it helps to manage expectations.
Looping back to retention for a moment, these stats are only the percentages for the people who stayed in. My specialist orientation class in 2012 had 7 FSCEs, there are only two of us left. She has been an FP-01 since 2021 and I have been an FP-03 since 2016. But by my totally unofficial count of the people I've known who are no longer FSCEs since 2018 (be it by retirement or resignation), here are the numbers I came up with for you to compare against HR's 2019-2023 plan (Appendix A1):
2019: -9
2020: -6
2021: -6
2022: -1
2023: -3
----------
Total: -25, or surprise, surprise, an average of 5 per year...just like the historical 2014-2018. And it's not like those 25 can be replaced at any level...the majority of new hires come in at FP-03. But given the historical trends, expect to sit there for about 6-8 years before being promoted up to FP-02.
You May Also Like:


Post a Comment